Saturday, June 24, 2023

A study in misplaced scientific flair

A senior and junior scientist are looking at a colorful painting on the lab wall. "What is it?," asks the older one. "You said to do an abstract," answers the young one.


It's the most-read part of scientific articles. Abstracts are supposed to give you a quick impression of research results. But while they may be small, they're crammed with traps. Hype in scientific articles seems to be escalating, and abstracts – those little study blurbs – tend to be the hypey-est part.

Of course, sometimes scientists have already gotten creative with a biased title for the article – bonus "points" for getting in first even earlier, with the study name or its acronym. (More on the acronymania menace here at Statistically Funny.)

What does this mean for us as readers? It means we can't be sure about the real takeaway messages from a study based on the abstract alone. Which, frankly, sucks. 

There's some good news at least: There's some serious research into the problem. And there are some telltale signs. I reckon you have to keep a sharp eye out for adjectives and adverbs – that's where things often take a spicy turn.

In May 2023, Olivier Corneille and colleagues published a list of 22 persuasive communication devices to watch out for in academic papers. Gulp! There's a summary of the list in table 1.

On the plus side, today's hype words mightn't work for long, thanks to "semantic bleaching". That's when overuse of hyperbole "'bleaches' out the stronger meaning of the word." Though I guess there will always be new buzz words to take their place. Sigh!


Disclosure: I'm a co-author of the 2013 PRISMA reporting guidelines for abstracts of systematic reviews. I have unfortunately contributed to the huge pile of conference abstracts that have never been followed by published papers, including a couple that evaluated the quality of abstracts (1998a, 1998b).

Wednesday, December 14, 2022

So, so many questions!


Cartoon blackboard. Science is a method for increasing the number of questions. Expressed by the formula: ? + science = (? + ?) squared


I first encountered science seriously as a health consumer advocate, a very long time ago. And I thought of medical and health research as a search for answers. Scientists were problem-solvers, using rigorous testing to sort out the wheat of reliable answers from the chaff of the false leads.


But over time, as I watched the research pile up exponentially, the number of questions was zooming up even faster.


We find out treatment A works. Who – and what – else could it work for? Can you have half the dose and still get just as much benefit? Does double the dose do more good than harm? Will it work even better if you combine it with treatment B? Combine it with treatment C? Combine it with B and C? Is it better than old treatment Q? Will work it in gel form? In spray? . . . 


Turns out scientific studies are, in fact, a great way to generate more questions. Answers, on the other hand, are often elusive.


So whose questions does science work with? For most of science’s history, the work has been dominated by one gender and one race, from just a few countries. The barriers to scholars from the Global South and access to, and recognition of, their work internationally remain shockingly high. On top of that, scientists typically worked at arm’s length from the people affected by the problems they were trying to solve. The result was often a very narrow set of questions. 


Consider the experience of clinical researchers in rheumatology. It wasn’t until after the field embraced consumer participation that fatigue, sleep, and disease flares were seen as important outcomes to measure. And the process changed their research culture, too.


Diversity in science is critical, too, to bring a variety of perspectives to the question-asking table. That includes diversity of disciplines in scientific teams. Working across disciplines doesn’t just bring different points of views into the process. It can be essential for scientific quality. Poor scientific methods that have been rejected in some disciplines, persist in other parts of academia. Interdisciplinary science might be able to spread superior scientific methods into fields with weaker science. 


If questions are so important to how our knowledge grows – and they are – then the issue of who gets to ask those questions is a fundamental concern. It can have a profound impact on what questions get addressed at all, and what is seen.


(This post is based on a 2019 post at Absolutely Maybe, drawing on the point on interdisciplinary science elaborated on in a 2022 post at Living With Evidence.)

Monday, November 21, 2022

Some studies are MONSTERS!


Cartoon of 2 small studies on one side of a meta-analysis, with a very big 3rd study on the other side pulling the studies' combined result over to his side. One of the little studies is thinking "That jerk is always throwing his weight around!"

On the plus side, this jerk explains a lot about the data in a meta-analysis!

This cartoon is a forest plot, a style of data visualization for meta-analysis results. Some people call them "blobbograms". Each of these horizontal lines with a square in the middle represents the results of a different study. The length of that horizontal line represents the length of the confidence interval (CI). That gives you an estimate of how much uncertainty there is around that result - the shorter it is, the more confident we can be about the result. (Statistically Funny explainer here.)

The square is called the point estimate - the study's "result" if you like. Often, it's sized according to how much weight the study has in the meta-analysis. The bigger it is, the more confident we can be about the result.

The size of the point estimate is echoing the length of the confidence interval. They are two perspectives on the same information. Small square and long line provides less confidence than a big square with a short line.


Cartoon showing a big smirking cartoon dragging the summary estimate diamond over to his side of the meta-analysis


The diamond here is called the summary estimate. It represents the summary of the results from the 3 studies combined. It doesn't just add up the 3 results then divide them by 3. It's a weighted average. Bigger studies with more events count for more. (More on that later.)

The left and right tips of the diamond are the two ends of the confidence interval. With each study that gets added to the plot, those tips will get closer together, and it will move left or right if a study's result tips the scales in one direction.

The vertical line in the center is the "line of no effect". If a result touches or crosses it, then the result is not statistically significant. (That's a tricky concept: my explainer here.)

In biomedicine, forest plots are the norm. But in other fields, like psychology, the results of meta-analyses are often presented as tables of data. That means that each data point - the start and end of each confidence interval, and so on - are numbers in a column instead of plotted on a graph. (Here's a study that does that.)

So what about that jerk? He carries so much weight not just because the study has a lot of participants in it. What's called a study's precision depends on the number of "events" in the study, too. 

Say the event you’re interested in is heart attacks – and you are investigating a method for reducing them. But for whatever reason, not a single person in the experimental or control group has a heart attack even though the study was big enough for you to have expected several. That study would have less ability to detect any difference your method could have made, so the study would have less weight.

It's very common for a study, or a couple of them, to carry most of the weight in a meta-analysis. A study by Paul Glasziou and colleagues found that the trial with the most precision carried an average of 51% of the whole result. When that's the case, you really want to understand that study.

Some studies are such whoppers that they overpower all other studies – no matter how many of them there are. They may never be challenged, just because of their sheer size: No one might ever do a study that large on the same question again.

The size of the point estimate and length of the line around it are clues to the weight of the study. The meta-analysis might also include the percentages of weight for each study.

Like to know more? This is a shorter version of one of the tips in my post at Absolutely Maybe5 Tips for Understanding Data in Meta-Analyses. Check it out for a more in-depth example of looking at the weight of a study and 4 more key tips!

Hilda

Monday, October 31, 2022

Researching our way to better research?


Cartoon: I do research on research. Person 2: Terrific! I research the research of research


Here we see an expert in evidence synthesis meet a metascientist!

Evidence synthesis is an umbrella term for the work of finding and making sense of a body of research – methods like systematic reviews and meta-analysis. And metascience is studying the methods of science itself. It includes studying the way science is published – see for example my posts on peer review research. And yes, there's metascience on evidence synthesis, too – and syntheses of metascience!

The terms metascience and metaresearch haven't been tossed around for all that long, compared to other types of science. Back when I took my first steps down this road in the early 1990s, in my neck of the science woods we called people who did this methodologists. A guiding light for us was the statistician and all-round fantastic human Doug Altman (1948-2018). He wrote a rousing editorial in 1994 called "The scandal of poor medical research," declaring "We need less research, better research, and research done for the right reasons." Still true, of course.

Altman and colleague, Iveta Simera, chart the early history of metascience over at the James Lind Library. Box 1 in that piece has a collection of scathing quotes about poor research methodology, starting in 1917 with this one on clinical evidence: "A little thought suffices to show that the greater part cannot be taken as serious evidence at all."

The first piece of research on research that they identified was published – with only the briefest of detail, unfortunately – by Halbert Dunn in 1929. He analyzed 200 quantitative papers, and concluded, "About  half of the papers should never have been published as they stood." (It's on the second page here.)

The first detailed report came in 1966, by a statistician and medical student. They reckoned over 70% of the papers they examined should either have been rejected or revised before being published. A few years after that, the methods for evidence synthesis took an important step forward when Richard Light and Paul Smith published their "procedures for resolving contradictions among different research studies" (Light and Smith, 1971.)

Evidence synthesis and metascience have proliferated wildly since the 1990s. And there's lots of the better research that Altman hoped for, too. Unfortunately, though, it's still in the minority – even in evidence synthesis. Sigh! Will more research on research help? Someone should do research on that!

Hilda Bastian


Tuesday, October 11, 2022

Trial participants and the luck of the draw


Cartoon: Any questions about the study results? Surprised person thinking "I was in a study?!"

The guy in this cartoon really drew a short straw: most clinical trial participants, at least, know they were in a study. On the other hand, he was lucky that he was getting to hear from the researchers about the study's results! That used to be quite unlikely.

It might be getting better: a survey of trial authors from 2014-2015 found that half said they'd communicated results to participants. That survey had a low response rate – about 16% – so it might not be the best guide. There are quite a few studies these days on how to communicate results to participants, though, and that could be a good sign. (A systematic review of those studies is on the way, and I'll be keeping an eye out for it.)

Was our guy lucky to be in a clinical trial in the first place, or was he taking on a serious risk of harm?

An older review of trials (up to 2010) across a range of diseases and interventions found no major difference: trial participants weren't apparently more likely to benefit or be harmed. Another in women's health trials (up to 2015) concluded women who participated in clinical trials did better than those who didn't. And a recent one in pregnant women (up to May 2022) concluded there was no major difference. All of this, though, relies on data from a tiny proportion of all the trials that people participate in – and we don't even know the results of many of them.

I think a really thorough answer to this question would have to differentiate the types of trials. For perspective, consider clinical trials of drugs. Across the board, roughly 60% of drugs that get to phase 1 (very small early safety trials) or phase 2 (mid-stage small trials) don't make it the next phase. Most of the drugs that get to phase 3 (big efficacy trials) end up being approved: over 90% in 2015. The rate is higher than average for vaccines, and much lower for drugs for some diseases than others.

Not progressing to the next stage doesn't tell us if people in the trials benefited or were harmed on balance, but it shows why the answer to the question of impact on individual participants could be different for different types of trials.

So was the guy in the cartoon above lucky to be in a clinical trial? The answer is a very unsatisfactory, it depends on his specific trial! However, overall, there's no strong evidence of benefit or harm. 

On the other hand, not doing trials at all would be a very risky proposition for the whole community. No matter which way you look at it, the rest of us have a lot of reasons to be very grateful to the people who participate in clinical trials: thank you all!


If you're interested in reading more about the history of people claiming either that participating in clinical trials is inherently risky or inherently beneficial, I dug into this in a post at Absolutely Maybe in 2020


Monday, October 3, 2022

How are you?


Cartoon of a person answering the question how are you with "about half a standard deviation below the mean"


A simple question, theoretically, has a simple answer. That's not necessarily the case in a clinical trial, though. To measure in a way that can detect differences between groups, researchers often have to use methods that bear no relationship to how we think of a problem, or usually describe it.

Pain is a classic example. We use a lot of vivid words to try to explain our pain. But in a typical health study, that will be standardized. If that were done with what's called a "dichotomous" outcome – a straight up "yes or no" type question – it can be easy to understand the result.

But outcomes like pain can be measured on a scale, which is a "continuous" outcome: how bad is that pain, from nothing to the worst you can imagine? By the time average results between groups of people's scores get compared, it can be hard to translate back into something that makes sense. That's what the woman in the cartoon here is doing: comparing herself to people on a scale.

It pays to never put too much weight on the name of an outcome – check what it really means in the context of that study. There could be fine print that would make a difference to you – for example, “mortality” is measured, but only in the short-term, and you might have to dig hard to figure that our. Or the name the outcome is given might not be what it sounds like at all. People use the same names for outcomes they measure very differently.

Even something that sounds cut and dried can be...complicated. “Perinatal mortality” – death around childbirth – starts and ends at different times before and after birth, from country to country. “Stroke” might mean any kind, or some kinds. And then there's the complexity of composite outcomes – where multiple outcomes are combined and treated as if they're a single one. More on that here at Statistically Funny.

Some researchers put in the hard work of interpreting study measures to make sense in human terms. It would help the rest of us if more of them did that!


This post is based on a section of a post on deciphering outcomes in clinical trials at my Absolutely Maybe blog.

Hilda Bastian

Wednesday, March 31, 2021

In clinical trials, you can have it both ways


Cartoon of people talking about being in the vaccine and placebo group


"Were you in the vax group or the placebo?" It sounds like a simple question, that should have a simple answer, right? And usually it does. Unless it doesn’t. Welcome to the world of the cross-over trial!

The garden variety randomized trial is a parallel or concurrent trial: people get randomized to one of 2 or more groups, and they continue on their parallel tracks, at the same time. At the end of it, if all goes well, you have solid answers to the main question or questions you set out to resolve.


In a cross-over trial, on the other hand, people start off in one group, then along the way, each group of people swaps over with those in another group. Everyone gets the same options, they are just randomized to going through them in a different order – intervention A then B, or intervention B then A. That’s how the guy in the cartoon can be in both the vaccine and the placebo group.


Graph showing crossing over between A and B


Let's start with the advantage of doing trials like this. A crossover trial means each person is their own control. With that one move, you have removed a common reason for differences in outcomes – individuals' differences. And that means you need fewer people to get an answer.


Every health intervention question can't be answered this way of course – think surgery versus antibiotics for appendicitis, for example, or a drug that isn't going to leave your body to revert back to your usual state during the break between interventions ("wash-out period").


But what about our guy in a vaccine trial, though? They don't fit this picture, do they? Vaccines may wash out, but the benefits to your immune system of recognizing its enemy sure isn't supposed to!


Crossover trials for vaccines are in the spotlight because they're being used for Covid-19 vaccine trials. I discuss this in depth over at Absolutely Maybe – and for more technical discussion on this, see this preprint on the thinking behind the proposal, and Steve Goodman's slides for the US Food and Drug Administration's deliberations.


The crossover extensions of the Covid vaccine trials can't do everything a randomized controlled trial can do, but they can provide valuable data on some issues, especially if the people stay blinded. High amongst those is how long immunity lasts. That's because you now have one group that was vaccinated early, and one group who had deferred vaccination. After the crossover, if the infection rate between the groups stays the same, you know the early-vaccinated group's immunity isn't waning.


Back to the average crossover trial, though, which will be of treatments. What should look out for with those?


One problem is if the groups before the crossover are treated as though they are parallel trials. That's risky. Randomizing enough people to a parallel trial means you don't have to worry about differences between the individuals skewing the results – you don't have that when you're randomizing the order of interventions, not the people.


You also have to keep in mind what possible influence could the previous intervention have had. If the trial goes on for a while, then you have to consider whether the different time periods are now a factor – and more people might have dropped out before they had the second intervention, too.


And 2 final bonus points: "N of 1" trials are cross-overs. That's when you are trying out treatments in a formally structured way, though like all cross-over trials, it only works in some situations. (A quick look at those here at Statistically Funny.) And there's another kind of trial where people are controls for themselves: (Here's my quick look at those.)


Hilda Bastian
March 2021


To learn more about crossover trials, check out Stephen Senn's book, Cross-Over Trials in Clinical Research. This link will help you find it in a library near you.


Sunday, August 12, 2018

Clinical Trials - More Blinding, Less Worry!


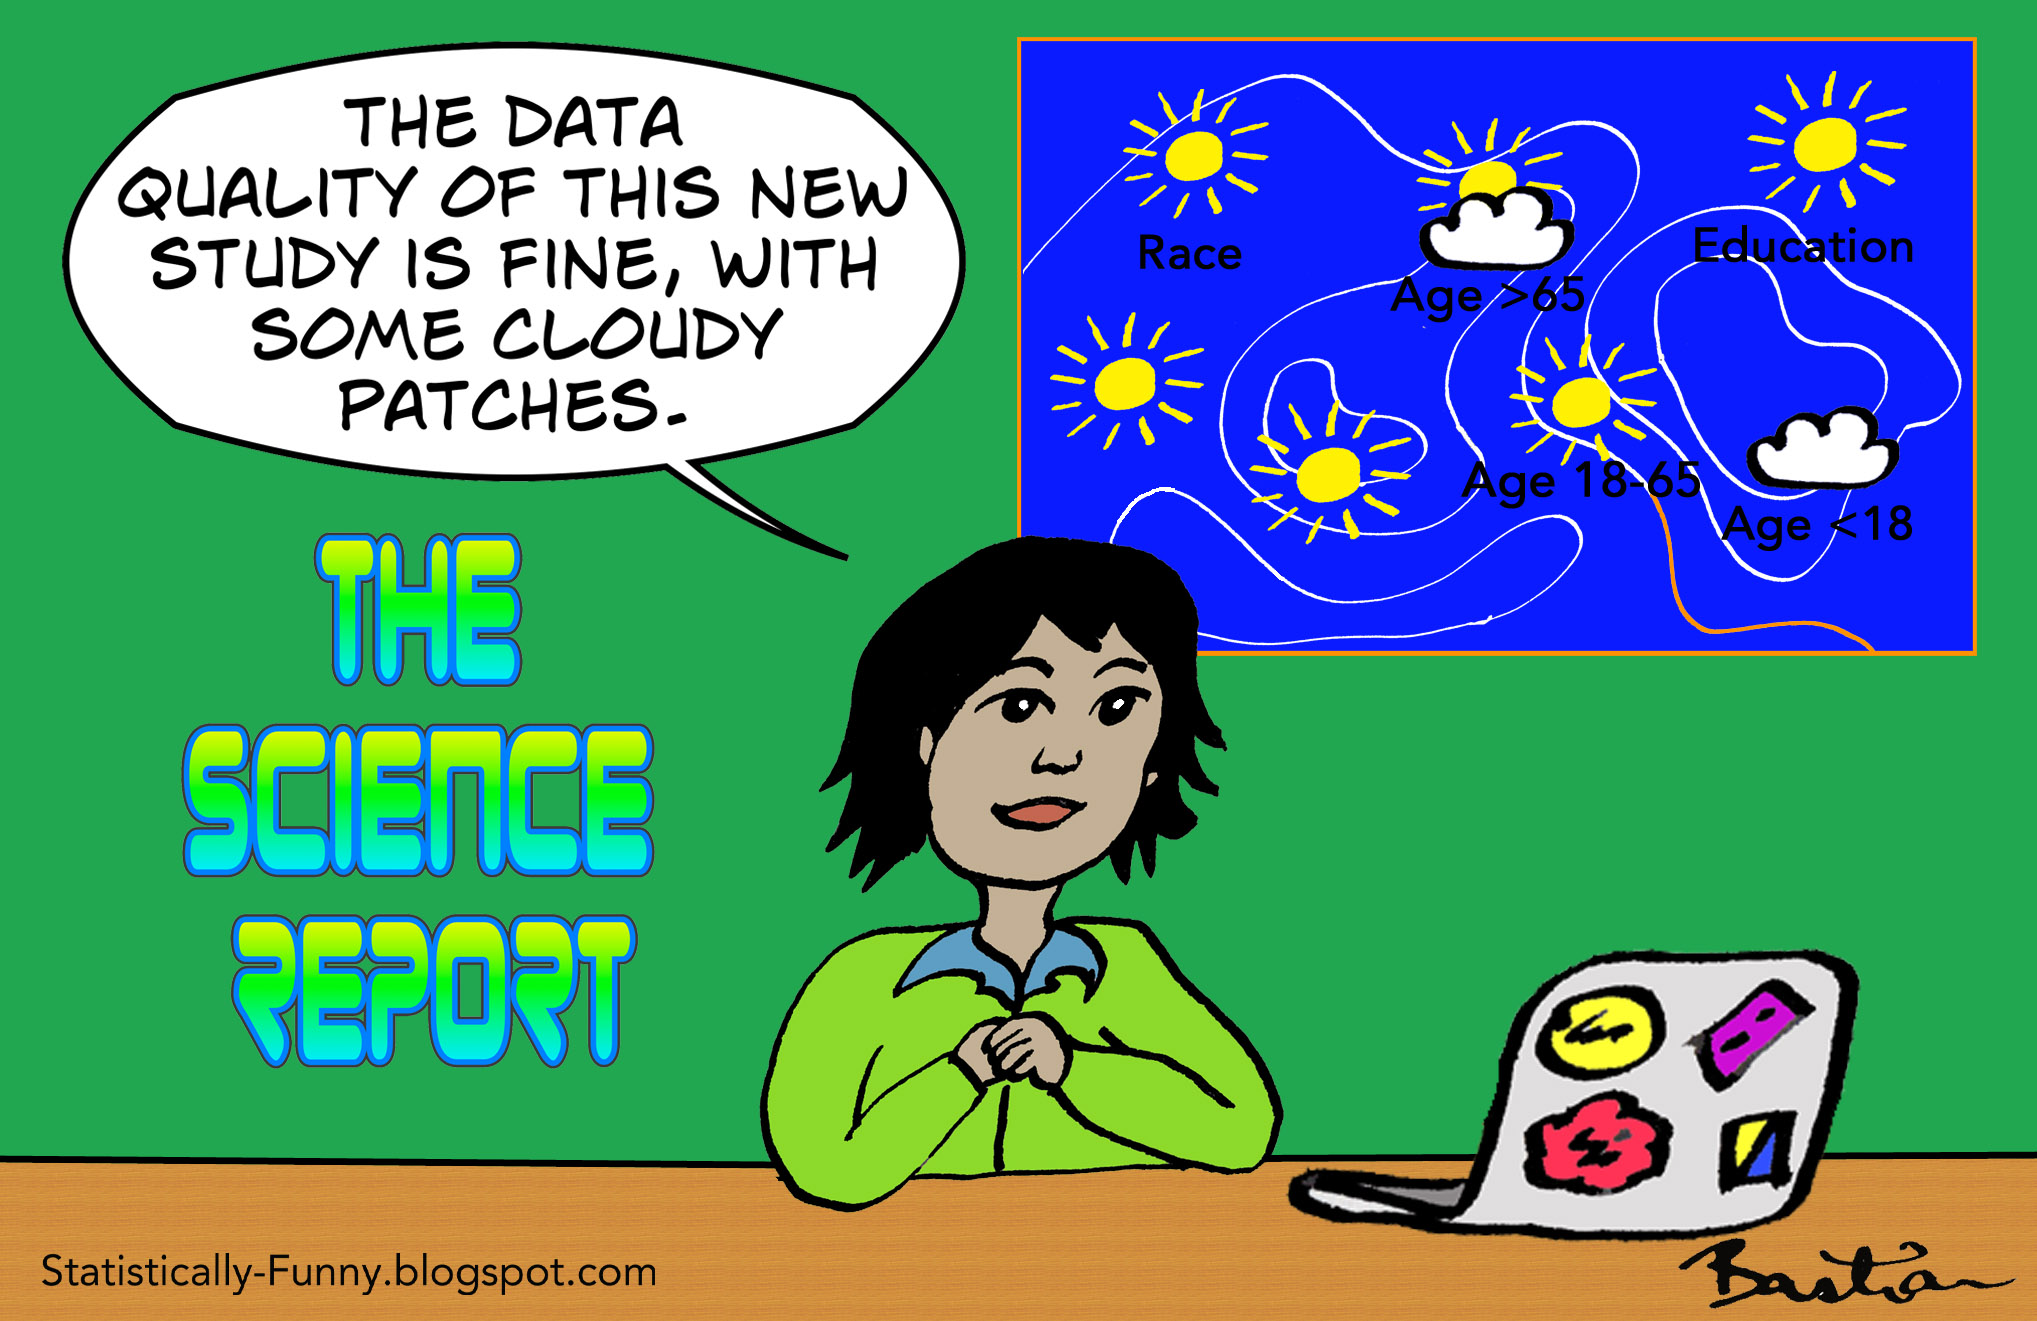
She's right to be worried! There are so many possible cracks that bias can seep through, nudging clinical trial results off course. Some of the biggest come from people knowing which comparison group a participant will be, or has been, in. Allocation concealment and blinding are strategies to reduce this risk.

Before we get to that, let's look at the source of the problems we're aiming at here: people! They bring subjectivity to the mix, even if they are committed to the trial - and not everyone who plays a role will be supportive, anyway. On top of that, randomizing people - leaving their fate to pure chance - can be the rational and absolutely vital thing to do. But it's also "anathema to the human spirit", so it can be awfully hard to play totally by the rules.

And we're counting on a lot of people here, aren't we? There are the ones who enter an individual into one of the comparison groups in the trial. There are those individual participants themselves, and the ones dealing with them during the trial - healthcare practitioners who treat them, for example. And then there are the people measuring outcomes - like looking at an x-ray and deciding if it's showing improvement or not.

What could possibly go wrong?!

Plenty, it turns out. Trials that don't have good guard rails for concealing group allocation and then blinding it are likely to exaggerate the benefits of health treatments (meta-research on this here and here).

Let's start with allocation concealment. It's critical to successfully randomizing would-be trial participants. When it's done properly, the person adding a participant to a trial has no idea which comparison group that particular person will end up in. So they can't tip the scales out of whack by, say, skipping patients they think wouldn't do well on a treatment, when that treatment is the next slot to allocate.

Some allocation methods make it easy to succumb to the temptation to crack the system. When allocation is done using sealed envelopes, people have admitted to opening the envelopes till they get the one they want - and even going to the radiology department to use a special lamp to see through an opaque envelope, and breaking into a researcher's office to hunt for info! Others have kept logs to try to detect patterns and predict what the next allocation is going to be.

This happens more often than you might think. A study in 2017 compared sealed envelopes with a system where you have to ring the trial coordinating center to get the allocation. There were 28 clinicians - all surgeons - allocating their patients in this trial. The result:
With the sealed envelopes, the randomisation process was corrupted for patients recruited from three clinicians.
But there was an overall difference in the ages of people allocated in the whole "sealed envelope" period, too - so some of the others must have peeked now and then, too.

Messing with allocation was one of the problems that led to a famous trial of the Mediterranean diet being retracted recently. (I wrote about this at Absolutely Maybe and for the BMJ.) Here's what happened, via a report from Gina Kolata (New York Times):
A researcher at one of the 11 clinical centers in the trial worked in small villages. Participants there complained that some neighbors were receiving free olive oil, while they got only nuts or inexpensive gifts.
So the investigator decided to give everyone in the same village the same diet. He never told the leaders of the study what he had done.
"He did not think it was important"....  
But it was: it was obvious on statistical analysis that the groups couldn't have been properly randomized.

The opportunities to mess up the objectivity of a trial by knowing the allocated group don't end with the randomization. Clinicians could treat people differently, thinking extra care and additional interventions are necessary for people in some groups, or being quicker to encourage people in one group to pull out of the trial. They might be more or less eager to diagnose problems, or judge an outcome measure differently.

Participants can do the equivalent of all this, too, when they know what group they are in - seek other additional treatments, be more alert to adverse effects, and so on. Ken Schulz lists potential ways clinicians and participants could change the course of a trial here, in Panel 1.

There's no way of completely preventing bias in a trial, of course. And you can't always blind people to participants' allocation when there's no good placebo, for example. But here are 3 relevant pillars of bias minimization to always look for when you want to judge the reliability of a trial's outcomes:

  • Adequate concealment of allocation at the front end;
  • Blinding of participants and others dealing with them during the trial; and
  • Blinding of outcome assessors - the people measuring or judging outcomes.

Pro tip: Go past the words people use (like "double blind") to see who was being blinded, and what they actually did to try to achieve it. You need to know "Who knew what and when?", not just what label the researchers put on it.


More on blinding here at Statistically Funny

6 Tips for Deciphering Outcomes in Health Studies at Absolutely Maybe.

Interested in learning more detail about these practices and their history? There's a great essay about the evolution of "allocation concealment" at the James Lind Library.


Monday, December 4, 2017

A Science Fortune Cookie


This fortune cookie could start a few scuffles. It's offering a cheerful scenario if you are looking for a benefit of a treatment, for example. But it sure would suck if you are measuring a harm! That's not what's contentious about it, though.

It's the p values and their size that can get things very heated. The p value is the result you get from a standard test for statistical significance. It can't tell you if a hypothesis is true or not, or rule out coincidence. What it can do is measure an actual result against a theoretical expectation, and let you know if this is pretty much what you would expect to see if a hypothesis is true. The smaller it is, the better: statistical significance is high when the p value is low. Statistical hypothesis testing is all a bit Alice-in-Wonderland!

As if it wasn't already complicated enough, people have been dividing rapidly into camps on p values lately. The p value has defenders - we shouldn't dump on the test, just because people misuse it, they say (here). Then there are those who think it should be abandoned or at least very heavily demoted (here and here, for example).

Then there is the camp in favor of raising the bar by lowering the level for p values. In September 2017, a bunch of heavy-hitters say the time has come to expect p values to be much tinier, at least when something new is claimed (here).

How tiny are they saying a p should be? The usual threshold has been p <0.05 (less than 5%). Instead of that being a significant finding, they decided, just a bit less than 0.05 should only be called "suggestive" of a significant finding. A significant new finding should be way tinier: <0.005.

That camp reckons support for this change has reached critical mass. Which is suggestive of the <0.05 threshold going the way of the dodo. I have no idea what the fortune cookie on that says! (If you want to read more on avoiding p value potholes, check out my 5 tips on Absolutely Maybe.)

Now let's get back to the core message of our fortune cookie: the size of a p value is a completely separate issue from the size of the effect. That's because the size of a p value is heavily affected by the size of the study. You can have a highly statistically significant p value for a difference of no real consequence.

There's another trap: an important effect might be real, but the study was too small to know for sure. Here's an example. It's a clinical trial of getting people to watch a video about clinical trials, before going through the standard informed consent process to join a hypothetical clinical trial. The control group went through the same consent process, but without the video.

The researchers looked for possible effects on a particular misconception, and on willingness to sign up for a trial. They concluded this (I added the bold):

An enhanced educational intervention augmenting traditional informed consent led to a meaningful reduction in therapeutic misconception without a statistically significant change in willingness to enroll in hypothetical clinical trials.

You need to look carefully when you see statements like this one. You might not be getting an accurate impression. Later, the researchers report:


[T]his study was powered to detect a difference in therapeutic misconception score but not willingness to participate.


That means they worked out how many people they needed to recruit based only on what was needed to detect a difference of several points in the average misconception scores. Willingness to join a trial dropped by a few percentage points, but the difference wasn't statistically significant. That could mean it doesn't really reduce willingness - or it could mean the study was too small to answer the question. There's just a big question mark: this video reduced misconception, and a reduction in willingness to participate can't be ruled out.

What about the effect size? That is how big (or little) the difference between groups is. There are many different ways to measure it. For example, in this trial, "willingness to participate" was simply the proportion of people who said "yes" or "no".

However, the difference in "misconception" in that trial was measured by comparing mean results people scored on a test of their understanding. You can brush up on means, and how that leads you to standard deviations and standardized mean differences here at Statistically Funny.

There are other specific techniques used to set levels of what effect size matters - but those are for another day. In the meantime, there's a technical article explaining important clinical differences here. And another on Cohen's d, a measure that is often used in psychological studies. It comes with this rule of thumb: 0.2 is a small effect, 0.5 is medium, and 0.8 is a large effect.

Study reports should allow you to come to your own judgment about whether an effect matters or not. May the next research report you read be written by people who make that easy!


Number needed to confuse: read more at Statistically Funny on the objectivity - or not! - in ways of communicating about effects.


Sunday, September 11, 2016

The Highs and Lows of the "Good Study"

Reporting on a study as though it's a weather report. Scientist at a desk has a map behind them, showing "sunny" for education, but cloudy for data on under-18s. (Cartoon by Hilda Bastian.)


Imagine if weather reports only gave the expected average temperature across a whole country. You wouldn't want to be counting on that information when you were packing for a trip to Alaska or Hawaii, would you?

Yet that's what reports about the strength of scientific results typically do. They will give you some indication of how "good" the whole study is: and leave you with the misleading impression that the "goodness" applies to every result.

Of course, there are some quality criteria that apply to the whole of a study, and affect everything in it. Say I send out a survey to 100 people and only 20 people fill it in. That low response rate affects the study as a whole.

You can't just think about the quality of a study, though. You have to think about the quality of each result within that study. The likelihood is, the reliability of data will vary a lot.

For example, that imaginary survey could find that 25% of people said yes, they ate ice cream every week last month. That's going to be more reliable data than the answer to a question about how many times a week they ate ice cream 10 years ago. And it's likely to be less reliable than their answers to the question, "What year were you born?"

Then there's the question of missing data. Recently I wrote about bias in studies on the careers of women and men in science. A major data set people often analyze is a survey of people awarded PhDs in the United States. Around 90% of people answer it.

But within that, the rate of missing data for marital status can be around 10%, while questions on children can go unanswered 4 times as often. Conclusions based on what proportion of people with PhDs in physics are professors will be more reliable than conclusions on how many people with both PhDs in physics and school-age children are professors.

One of the most misleading areas of all for this are the abstracts and news reports of meta-analyses and systematic reviews. It will often sound really impressive: they'll tell you how many studies, and maybe how many people are in them, too. You could get the impression then, that this means all the results they tell you about have that weight behind them. The standard-setting group behind systematic review reporting says you shouldn't do that: you should make it clear with each result. (Disclosure: I was part of that group).

This is a really big deal. It's unusual for every single study to ask exactly the same questions, and gather exactly the same data, in exactly the same way. And of course that's what you need to be able to pool their answers into a single result. So the results of meta-analyses very often draw on a subset of the studies. It might be a big subset, but it might be tiny.

To show you the problem, I did a search this morning at the New York Times for "meta-analysis". I picked the first example of a journalist reporting on specific results of a meta-analysis of health studies. It's this one: about whether being overweight or obese affects your chances of surviving breast cancer. Here's what the journalist, Roni Caryn Rabin wrote - and it's very typical:

     "Just two years ago, a meta-analysis crunched the numbers from more than 80 studies involving more than 200,000 women with breast cancer, and reported that women who were obese when diagnosed had a 41 percent greater risk of death, while women who were overweight but whose body mass index was under 30 had a 7 percent greater risk".

There really was not much of a chance that all the studies had data on that - even though you would be forgiven for thinking that when you looked at the abstract. And sure enough, this is how it works out when you dig in:

  • There were 82 studies and the authors ran 31 basic meta-analyses;
  • The meta-analytic result with the most studies in it included 24 out of the 82;
  • 84% of those results combined 20 or fewer studies - and 58% had 10 or less. Sometimes only 1 or 2 studies had data on a question;
  • The 2 results the New York Times reported came from about 25% of the studies and less than 20% of the women with breast cancer.

The risk data given in the study's abstract and the New York Times report did not come from "more than 200,000 women with breast cancer". One came from over 42,000 women and the other from over 44,000. In this case, still a lot. Often, it doesn't work that out way, though.

So be very careful when you think, "this is a good study". That's a big trap. It's not just that all studies aren't equally reliable. The strength and quality of evidence almost always varies within a study.


Want to read more about this?

Here's an overview of the GRADE system for grading the strength of evidence about the effects of health care.

I've written more about why it's risky to judge a study by its abstract at Absolutely Maybe.

And here's my quick introduction to meta-analysis.